Update Frequency - Please Read This! - We do our best to update the chlorophyll charts on a daily basis. There is usually only 1 usable satellite shot per day to work with. Every 4-5 days the orbit of the satellite causes the area to be missed completely. Clouds block the satellite's view, and the glare of the sun can also block the satellites ability to see the water. So in reality about the best we can expect is to have a new chlorophyll shot 4-6 times per week. That's assuming some clear weather; cloudy conditions will further reduce the frequency. If we get more frequent shots then of course we will process them, but it is important to understand up front what the limitations are. With the SST shots we work with data from 4 satellites, both day and night shots. We get the Chlorophyll data from 2 satellites (but really only 1 provides consistently good data), and only the daytime shot is of use. We'll still have the much more frequent SST charts though, so once you match up the right kind of water on the charts you can watch it daily on the SST.
Understanding the charts - Simply put, the charts indicate the concentration of chlorophyll in the water, measured in milligrams per cubic meter. High levels of chlorophyll will be represented by the red / yellow colors, low levels will be shown as blue shades on the chart. We've used a different color palette just to keep the charts differentiated from the SST's.
Interpreting the information - Chlorophyll in the water is generally produced by plankton, so what we are in effect measuring is the amount of plankton (food!) in the water. High levels of chlorophyll should indicate off color, nutrient rich water. Lower levels of chlorophyll should indicate cleaner water, and hopefully the very low levels will indicate clean blue water. Remember that the clean blue water is also most likely very low in nutrients. So the best combination for offshore fishing would be to find where the clean blue water (assuming the temp is good) meets an area with a higher level of plankton. That area will be more likely to hold baitfish and to concentrate the fish. Sounds like we're fishing temp breaks, doesn't it? Essentially, we've probably been fishing plankton breaks all along. We're not always looking for clean blue water though. For Salmon fishing, you typically look for the nutrient rich, off-color water. In that case, then you want the areas on the chart with the higher levels, shown in red / yellow. Again working the edge would be best.
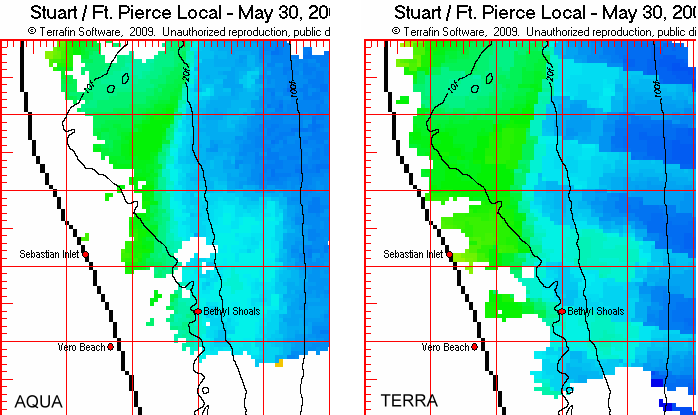
Aqua vs. Terra Satellite images - For the most part we get the bulk of our data from the AQUA satellite. There is actually a second satellite called Terra that provides the same chlorophyll data. Unfortunately a problem with the instrument on the Terra satellite causes the images to be very degraded, and most of the time they have severe "striping". The majority of the time we will stick with data from AQUA, but there are times when cloud cover or the sun glint or just the satellite position results in no usable data for an area. We will always then look at the Terra data for coverage. When we use these shots the images can be very poor, but very often they still contain usable information. An ugly shot is better than no shot at all! The striping in particular is the main issue, but you can learn to "look past" the stripes and you can still see the edges in the imagery. Below is an example, with an AQUA shot on the left vs. a Terra shot on the right. By ignoring the stripes you can see how the edges match up.